


This guide is the third in a series of new guides brought to you by

In this installment the focus will be on reporting. I find that with a few basic (and some not so basic) tricks, you can quickly build data solutions customized to your exact needs. Even more importantly, you can set up in a way to let others build them, so you don’t have to!
If you are not familiar with how reports work within Docebo itself, including the New Reports, Standard Reports, and the Automation App (useful for FTP reports), I highly recommend going and reading the official documentation as well as checking out the topic in Docebo University. I will assume you are familiar with them throughout this article.
One common request in the community is to make specific data changes or add columns to reports that are not currently available. The general goal of these requests is to be able to schedule the report, have it emailed to a user, and let them be able to use it out of the box. While this should happen if possible, it is not always an option as everyone has individual needs which often conflict with each other.
Learning to use the initial reports from Docebo as raw data allows you to build upon and customize them according to your needs. Throughout the sections below we will walk through a few ways to accomplish this.
Guide Table of Contents
Using CSV Files as Data Sources
Setting Up the Data Query
This is the simplest as all you really need is a computer, the Docebo report in CSV format, and Excel. Most people take the CSV file from Docebo, open it directly in Excel, and begin editing it. This means that any changes, tables, sorting, etc. have to be done directly to the file each time—quite the time commitment.

Instead, you can have Excel load the CSV file as an external data source and query it. You will still be able to see the original data, but you can then build multiple tables, graphs, anything you want that Excel can do, and not need to repeat it every day. Using this technique you can also load multiple CSVs as data sources and use them together in the Excel workbook. What does this mean? When the Docebo report does not have all the information in it you need, you can combine reports to get the information, or bring in information from other systems too. Incredibly powerful. Let’s walk through the basics:
-
Build and download a CSV report from Docebo, and save it someplace on your computer where you know where it is.
Yes, you can put the file on a shared drive. If you want to take this a step further, you can have the file transferred to the shared drive if it has FTP access using the Docebo Automation app.
- You want this file to have a descriptive but generic name, so make sure to remove any date information from it.
- Open Excel and create a new workbook (do not open the CSV file yet).
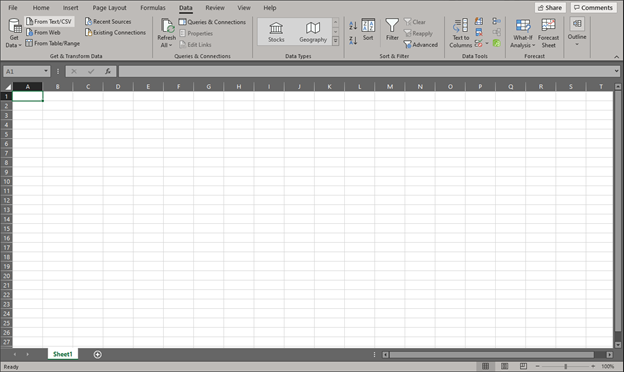
- In the top ribbon, select the ‘Data’ tab.
- Look for the option ‘From Text/CSV’ (this may be on its own, or under a ‘From File’ drop down).
-
Navigate and select the CSV file you downloaded from Docebo and select ‘Import’.
- You should see a preview of your data after a connection is established. Make sure it looks ok.
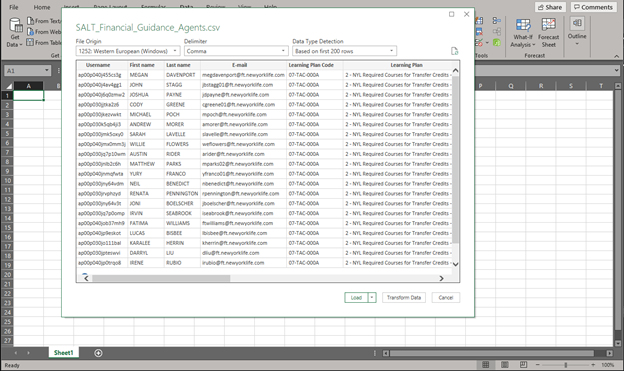
- Select ‘Load’.
You can edit the data coming in using the ‘Transform Data’ option if you want. This will let you convert text, merge data, insert new columns, etc. This is a more advanced setup, but is useful to learn. Definitely check out some YouTube videos if you are interested.
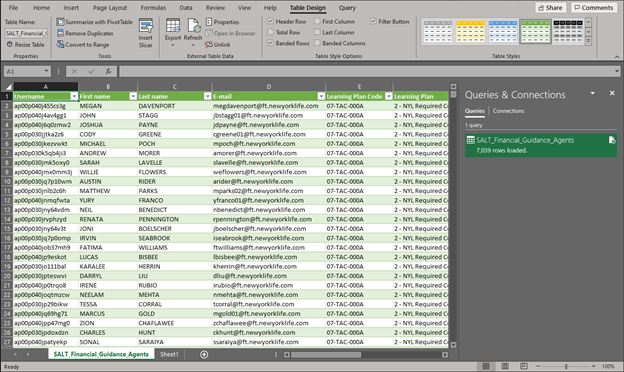
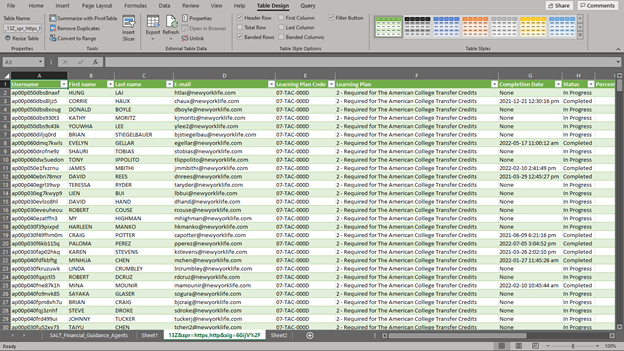
- You should notice two things:
- First, the CSV data has been loaded into an official Excel Table and the sheet it is on has been renamed the name of the CSV file. You can apply normal filters and sort the table here if you wish.
-
The ‘Queries & Connections’ pane opens and you can see information about what was loaded.
- Right click the query that was created (it should have the name of the CSV file) and select ‘Properties…’.
- On the ‘Refresh control’ options, I recommend selecting ‘Refresh data when opening the file’. This means the Excel file will open a little slower, but that it will look at the CSV file and reload the data whenever opened. What does this mean for you? You can send this to people and not have to worry about teaching them how to refresh the data. They can just open the file.
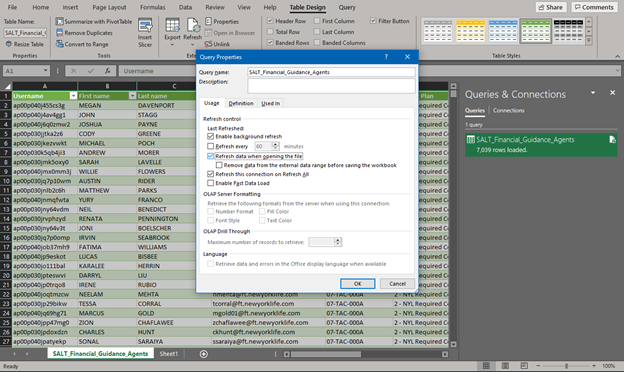
- Select ‘Ok’.
You can repeat the above process within the same file multiple times bringing in multiple tables and queries. This is incredibly useful for merging reports.
Building on Top of the Query
At its core, we are done. What we now have is an Excel file that is using a downloaded CSV file from Docebo as a data source. If you replace the CSV file, when you open the Excel file everything within will be updated. To demonstrate this, let’s make a pivot table using the existing connection. I will be using my file as a proof of concept, but keep in mind—if it is a function you can do in Excel, you can now do it using the data connection.
-
We already have established a data connection and loaded a Docebo report. Move to a new sheet.
- On the top ribbon, select the ‘Insert’ tab.
- Select ‘Pivot Table’.
- Select ‘Use an external data source’.
- Select ‘Choose Connection’.
- Select ‘Tables’.
- Select the table created previously.
Yes, you can select the query from the ‘Connections’ tab, but this will create a duplicate query to manage. That is why I recommend using the table.
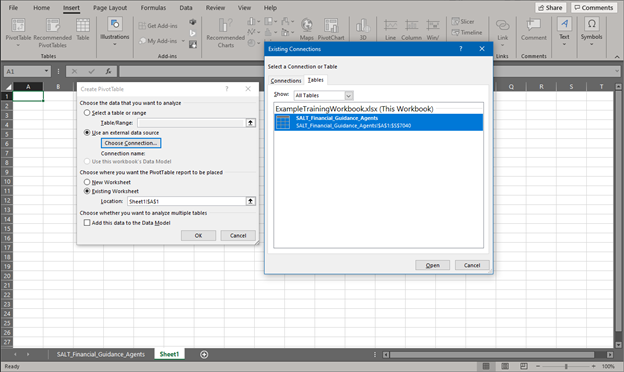
- Select ‘Open’.
- Select ‘Ok’.
- On the top ribbon, select the down arrow under ‘Refresh’.
- Select ‘Connection Properties’.
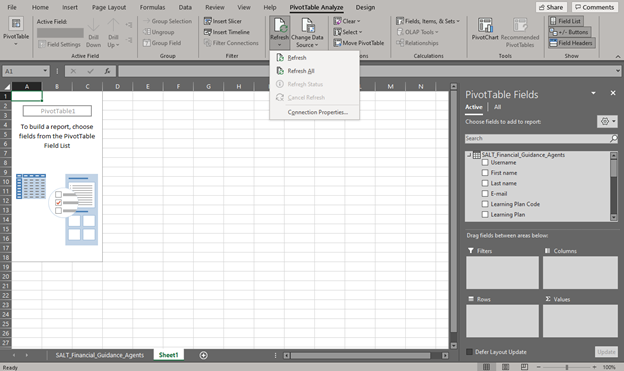
- Check the box ‘Refresh data when opening the file’.
This is optional, but nice to do so others don’t need to worry about refreshing.
- Build out your pivot table!
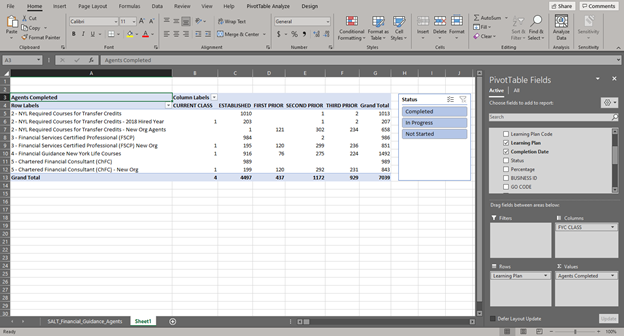
In my example here, I took the raw data in the first worksheet and built a table to show how many people have completed a set of learning plans, and all this broken up by known groupings of users within the organization. Now, I update the base CSV file on my computer by downloading it and then reopen the file where all the analysis has been done. This was a very simple example, but I think you can understand how this provides you with options. You can either build out powerful dashboard reports (for others to simply refresh), or you can stop once the connection has been established (and allow others to build their tables).
You might be saying, ‘but the CSV file is on my local computer, how can others see it?’ As mentioned earlier, you could set this up on a shared or cloud drive. Remember, if you use the automation app in Docebo, you can have a report FTP’d to a file server. If you need to get the file to a cloud location, keep reading.
Use Power Automate to Save the Report to a Cloud Source
The above setup is very powerful as is, and it will help complete a lot of the requests for data/tables/custom analysis. For those a bit more adventurous, here is another trick.
Before we go step by step, know that this is one example of how to do this setup using the tools I have available to me. You may have different ones, so talk about it with your IT team to figure out the best route.
The goal of this setup is to move the standard CSV file to a publicly accessible cloud space (like Amazon AWS or Microsoft Azure). This can then become the direct data source in your Excel, Tableau, or Power BI document.
The first thing to do is to create the report in Docebo and schedule it to trigger the process. In my case I will be using Power Automate, so I will have the Docebo report emailed, but you could take another approach. Instead you could use the Automation app to transfer the file to a location using FTP and build a process to get the file where it needs to be.
Here’s how I do it:
-
Create the report in Docebo and schedule it to send to a shared email inbox.
- In the shared email inbox, create both a new subfolder for this process and an inbox rule to identify the report email when it arrives and move it to the folder.
While you don’t have to filter these emails, managing them this way keeps your inbox cleaner and reduces the chance of false triggers in the Power Automate flow.
- Log into and upload a version of the CSV file to the Azure File Storage used for this.
We will be ‘Updating’ this file programmatically so it must exist first. Make sure to use a generic name for this file.
- Log into https://portal.office.com and navigate to Power Automate.
- Select ‘Create’.
- Select ‘Automated cloud flow’.
- Give it a distinctive and descriptive name and select ‘When a new email arrives’ as the trigger.
- Select ‘Create’.
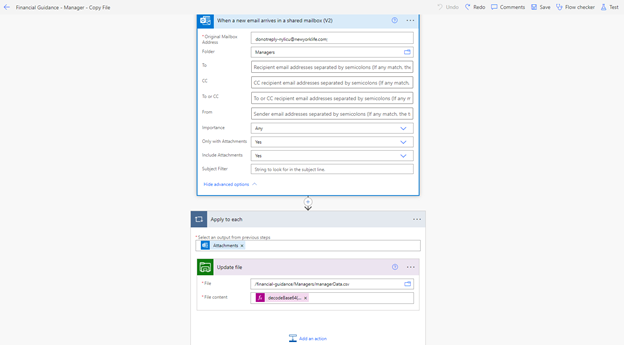
- On the Trigger make sure to adjust the following settings:
- Original Mailbox Address: Needs to be updated to be the email the report is being sent to.
- Folder: Navigate to the subfolder that the inbox rule will move the email to (set in step 2).
- Only with Attachments: Set to Yes.
- Include Attachments: Set to Yes.
- Add an action and select ‘Apply to Each’.
- In the ‘Select an output from previous steps’, select ‘Attachments’ from the email trigger.
- Add an action within the ‘Apply to Each’ loop and select ‘Update File’ (Azure File Storage).
- Use the folder navigation on the right side to navigate to the file you uploaded previously.
- Under ‘File Content’, put the following in the expression field. This will convert the body of the attachment to a usable format for updating the file:
decodeBase64(items('Apply_to_each')?['contentBytes'])
- Save the flow.
- In your Azure file storage area, the easiest thing to do is to create a Shared Access Signature (SAS) embedded into a URL for the file you are storing. This lets you block general public access to your storage area, but if you have the proper encoded URL, access is granted. Information on this process can be found on Microsoft Docs website here. AWS has a similar way to set up access to S3 files.
- Now that you have the shared file secure link, open Excel.
- In the top ribbon, select the ‘Data’ tab.
- Select ‘From Web’.
- Enter the Azure URL into the URL field.
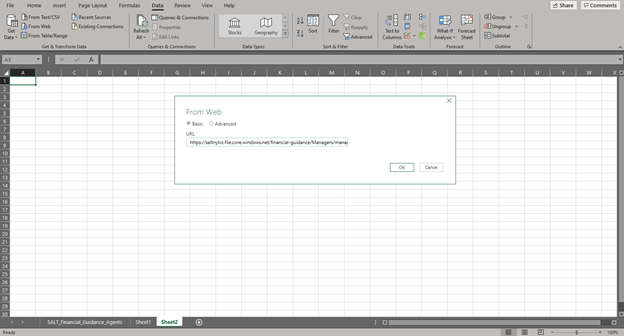
- Select ‘Ok’.
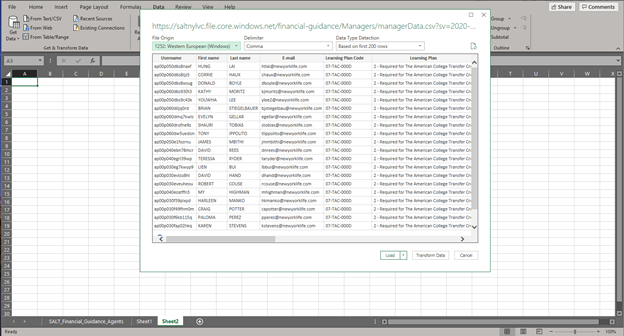
- Select ‘Load’.
You can edit the data coming in using the ‘Transform Data’ option. This will let you convert text, merge data, insert new columns, etc. This is a more advanced setup, but it is useful to learn. Definitely check out some YouTube videos if you are interested.
- Right click the query that was created (it should have the name of the CSV file) and select ‘Properties…’.
- On the ‘Refresh control’ options, I recommend selecting ‘Refresh data when opening the file’. This means the Excel file will open a little slower, but also that it will look at the CSV file and reload the data whenever opened. What does this mean for you? You can send this to people and not have to worry about teaching them how to refresh the data. They can simply open the file.
- Select ‘Ok’.
In this setup, the CSV is being copied to a server available from anywhere in the world, every day, automatically, and the Excel file automatically refreshes the data source every time you open it. This allows for the creation of some great Excel based dashboards and analysis. Keep in mind, these data sources are usable by other types of software like Tableau and Power BI.
Build a Report with the API
In this article so far, we have looked at building a report from the Docebo custom report builder and transferring it to another program to analyze. This is the default route that I use, but there are not always great base reports to work with for this purpose. In this case, the API can be used to build a report, which can then be used similarly as explained above. To demonstrate this, I will walk through two practical examples where this was required.

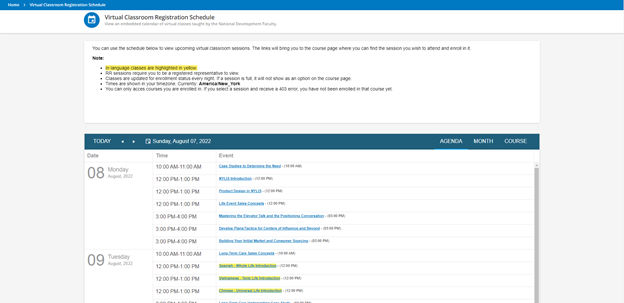
Example 1: Custom ILT Calendar Data Source
In this first example, the end goal was to create a customized calendar of our national ILT classes. Around a 100 to 150 of these were scheduled and run each month, and there were some in different languages and some for specific types of users. The built-in calendar simply was not working for our needs.
We decided to build our own using a jQuery framework which required a CSV file as its data source:
Here’s an overview of this process:
-
We scheduled a Power Automate flow every hour.
-
This flow used the Docebo API through the custom connector built previously to return only a specific set of courses.
-
The Docebo custom connector was then used to return future sessions for each of those courses.
-
Those sessions were then organized into a CSV table.
-
That table was then updated on a file stored in Azure File Storage.
-
This file was given to the developer of the calendar to use as the data source when the calendar is loaded.
Let’s walk through the specifics:
-
In Power Automate, open up the custom connector to add the following APIs if you have not added them already:
-
Return Courses – GET - /course/v1/courses
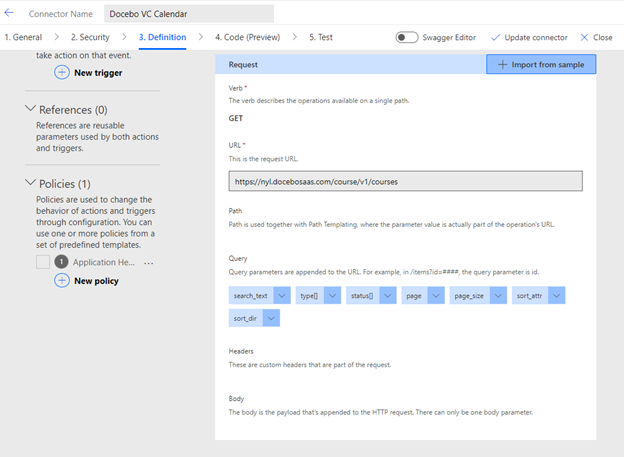
Tip: Make sure to add the parameters needed to help you refine/search for specific courses.
-
Return Sessions – GET - /course/v1/courses/{course_ID}/sessions
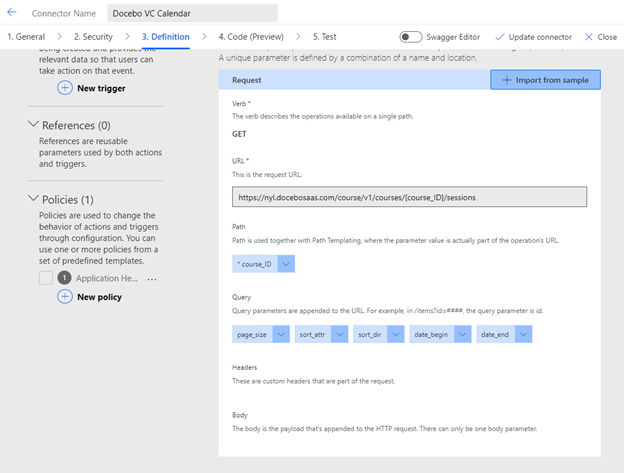
Tip: Make sure to add the parameters needed to help you refine/search for specific courses.
-
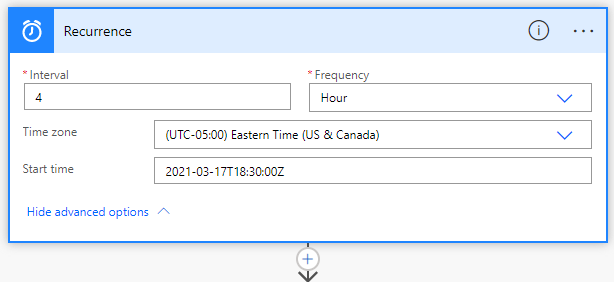
- Save the custom connector and create a new ‘Scheduled flow’.
- Set the Recurrence interval to what works best for your needs.
- Create Variables and define them as following:
| Name | Type | Value |
| StartTime | String | |
| EndTime | String | |
| CurrentMonth | String | formatDateTime(utcNow(),'yyyy-MM-dd') |
| AllSessionsList | Array | |
| EnrollmentRatio1 | String | |
| EnrollmentRatio2 | String | |
| EnrollmentRatioFinal | String | |
| ClassFullCheck | String | |
| URLForm | String | |
| SessionID | String | |
| CourseID | String | |
| SessionName | String |
- Add an item and select ‘Return Courses’ from the Docebo custom Connector.
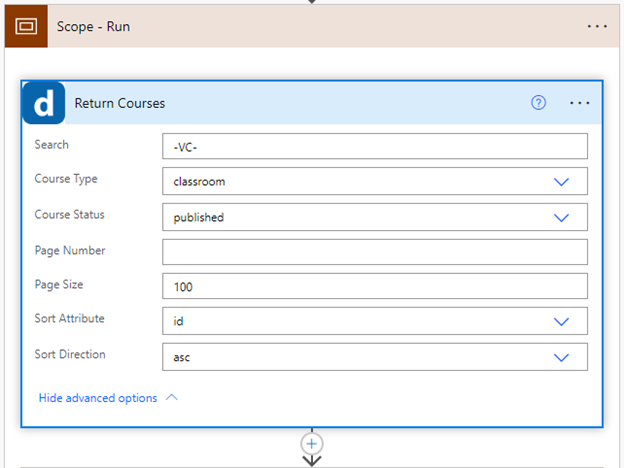
- Fill in any search parameters to limit the courses returned to only those you wish.
Tip: Include a unique string in the course IDs or names to make this easier. In the examples shown, ‘-VC-‘ is the unique string for all our national virtual classes.
- Add an item and select ‘Return Sessions’.
- In the Course ID field, select the ‘id’ dynamic content from the Return Courses step.
Note: This will trigger a ‘for each’ loop, and that is ok.
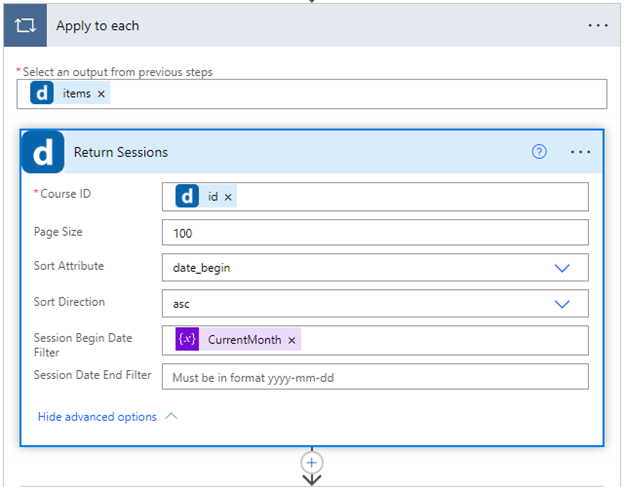
- We only want future sessions, so in the ‘Session Begin Date Filter’ on the Return Sessions block, select the ‘CurrentMonth’ variable. Also set the Sort Attribute to ‘date_begin’ and Sort Direction to ‘asc’.
- Now we are going to loop through each session returned, do a few calculations, and load that information into an Array that can be converted into the CSV table later. The following variables are updated with the following information:
| Name | Value |
| EnrollmentRatio1 | enrolled (from returned session call) |
| EnrollmentRatio2 | max_enroll (from returned session call) |
| EnrollmentRatioFinal | div(float(variables('EnrollmentRatio1')),float(variables('EnrollmentRatio2'))) |
| ClassFullCheck | if(greaterOrEquals(variables('EnrollmentRatioFinal'),1.00),'Full','Space') |
| CourseID | id (from returned courses call) |
| SessionID | id (from returned sessions call) |
| SessionName | name (from returned sessions call) |
| URLForm | concat('https://<YOUR DOCEBO SUB DOMAIN>.docebosaas.com/lms/index.php?r=site/sso&sso_type=saml&id_course=',variables('CourseID'),'&session_id=',variables('SessionID')) |
| StartTime | date_start (from returned sessions call) |
| EndTime | date_end (from returned sessions call) |
-
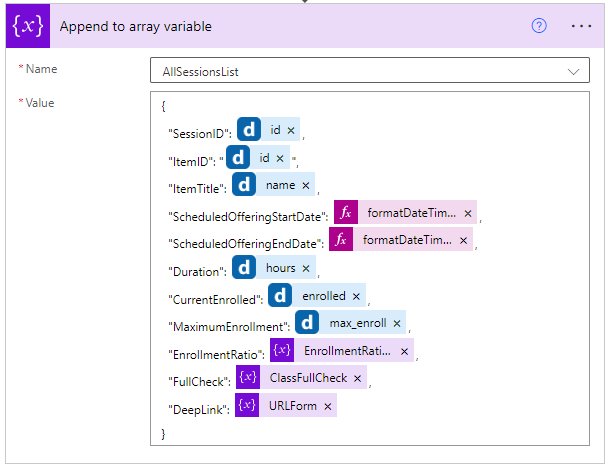
The last variable to update is the ‘AllSessionList’ which will get an array item appended to it. The format of this is shown below:
{

"SessionID": @{items('Apply_to_each_2')?['id']},

"ItemID": "@{items('Apply_to_each')?['id']}",

"ItemTitle": @{items('Apply_to_each_2')?['name']},

"ScheduledOfferingStartDate": @{formatDateTime(variables('StartTime'),'r')},

"ScheduledOfferingEndDate": @{formatDateTime(variables('EndTime'),'r')},

"Duration": @{items('Apply_to_each_2')?['hours']},

"CurrentEnrolled": @{items('Apply_to_each_2')?['enrolled']},

"MaximumEnrollment": @{items('Apply_to_each_2')?['max_enroll']},

"EnrollmentRatio": @{variables('EnrollmentRatioFinal')},

"FullCheck": @{variables('ClassFullCheck')},

"DeepLink": @{variables('URLForm')}

}
-
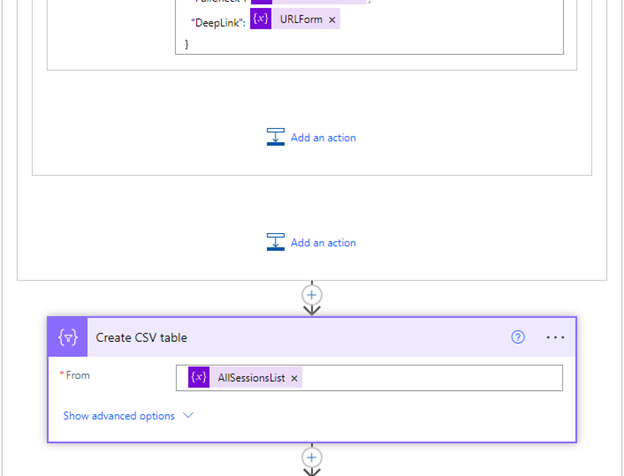
Outside of the looped actions, add an action and select ‘Create CSV Table’.
Tip: If the application can accept JSON directly, you could simply skip this step and pass the array from above.
- In the ‘From’ field of ‘Create CSV Table’, put the ‘AllSessionList’ variable.
- Leave ‘Columns’ set to ‘Automatic’.
- Add a new item and select ‘Update file’ (Azure File Storage).
- Navigate to the CSV file you wish to update using the file icon.
- In ‘File Content’, insert the ‘Output’ from the ‘Create CSV Table’ Step.
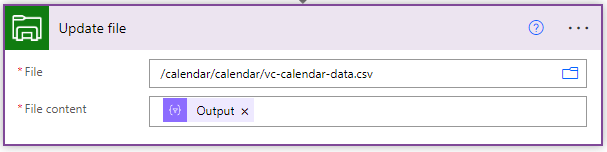
- Save your flow.
Now every hour, the flow will run, pull the new information, and update the file so that the calendar can be updated in kind. We will be covering how the front end of this calendar works later in the series.
Example 2: Email Instructors All Classes for the Day
In this second example, we are once again dealing with our national virtual classes. There are typically 100 to 150 each month and upwards of 8 a day. There are 5 to 8 instructors for all of these at any given time. It became useful for them to get a daily email of current enrollment status so that they could quickly decide whether to cancel classes early in the morning. Since we add instructors at the session level, not the event level, it became hard to use an existing report without a lot of modifications. We also wanted a notice pushed to instructors.
This flow gets highly customized due to its nature, so instead of going through every step (there are close to 200 in all), I am going to talk it through at a high level. At this point, you can see how these work and how they could be used in similar applications (like Docebo Connect).
-
Schedule a flow to run daily at an appropriate time. For us it was 6 am.
- Use the Docebo API through the custom connector to look up the ILT classes we need.
- Use the Docebo API through the custom connector to look up the sessions of those courses, but filter to only show sessions with start and end dates within the current day. (For this, we only care about today’s sessions.)
- Manipulate the information returned to create an array (report) of all the sessions with the following information:
-
Formatted date and time (to sort by)
-
Course URL
-
Start time of the session
-
Percentage of enrolled learners (currently enrolled divided by the maximum enrollment of the session)
-
Instructor name
-
- Then, because the list has been created course by course, I want to organize the full list to be in date/time order. I can sort based on that first date/time column.
- Now I can create a series of HTML tables. One will be for managers and include all of the classes for the day. The other will show those classes filtered by instructor so that each instructor only sees their own sessions. This table goes into an email, and they are kept in the loop automatically!
Here is an example of the email received by managers including all the sessions:
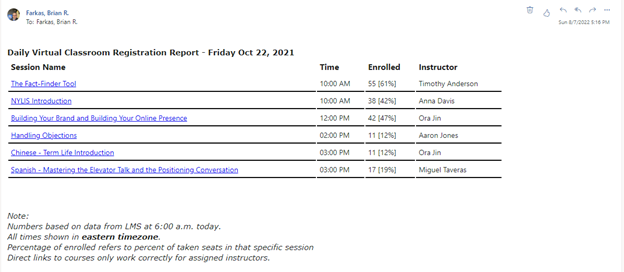
Notice the session names are hyperlinked. This brings the manager straight to the session within Docebo so that they are able to send emails to those enrolled, cancel the session, etc.
Here is an example from the same day, to an individual instructor:
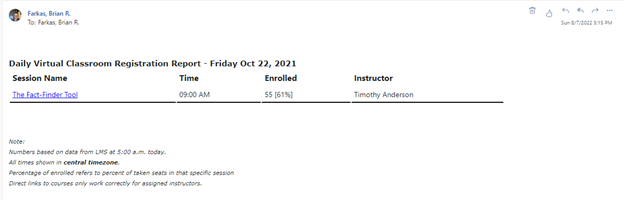
Notice only one class is listed, as that is all Tim is responsible for today. He doesn’t have to filter through a long sessions list. Also, the time of the class was converted to that instructor’s time zone for his convenience.
What’s next?

I hope you can see the power of not treating exports from Docebo as completed reports, but rather as starting points for retrieving data. It starts with the setup and as you grow more comfortable doing it, you see just how much is possible.
In the next installment, we will take a look at webhooks: what they are, how you might use them, and how to configure them. If you ever wanted to be able to be notified of an event from Docebo in real time, this one is for you.

