Most active learners report? What are your favorite custom reports?
Good morning! We are three weeks from our soft launch and while our team is still learning about all of the features, I thought I would reach out to this group for a question I can’t find an answer to elsewhere. What is your favorite report for finding your most active learners, or do you use gamification? The Branches report (when switched to user view) show the individual courses users have taken. The Users report - shows the users/data/ The Courses report - seems to show only the courses.
How can I pull a report that shows me a roll up per user of the courses they’ve taken (by branch)? Bonus question: Do you have a favorite custom report you’ve built?
Page 1 / 1
Hello ;) I am going to show you my perspective of the reports – the most active learners.
I see that you are familiarized well with this option – New custom reports ;)
If we would like to obtain data about courses activity, we should select reporting options “Users - Courses" or “Courses –Users”. Fantastic thing in mentioned reports is the fact, that we can select many additional columns useful in filtration (creating excel pivots).
The same is with Gamification. If we want to get information about Badges/gamification, we need to generate report “Users – Badges”. Default report is extensive and developmental as well (using additional Users fields, Badges fields)
In my daily routines, I work mainly with additional columns from section “Users columns” or “Course fields” or “Badge fields”. More selected columns = more possibilities, but of course it depends on what you would like to obtain.
When I will export interesting columns, I am going to “check” data and prepare pivots in excel what give me more reporting options (e.g. counting,sorting ascending/descending, filtering by Departments/Courses/Branches)
* How can I pull a report that shows me a roll up per user of the courses they’ve taken (by branch)?
Hmm, I think you can select several branches at the beginning – no worries. You can select column “Branches” that is available during field selections. Having this column and many else (e.g. Department, Courses Name) you can filter data freely after export.
That is my point of view for very beginning. I encourage you to “play with reports” and familiarize with data. Then everything will be easier ;)
Hi there @TaviaRitter! @ABoronski was right on the money with his recommendation for Users - Courses, Courses - Users, and Users - Badges reports to accomplish the use cases you shared. Here’s my recommendation for your question:
How can I pull a report that shows me a roll up per user of the courses they’ve taken (by branch)?
Navigate to Admin Menu >New Reports
Select + New Report
Create a Users - Courses custom report
In the Filters tab, use a Custom Selection for your Users, selecting the branch(es) you’d like to report on. Tip: Use a parent branch, including descendants, to easily report on multiple branches dynamically.
Select the Courses you’d like to report on in the Filters tab
Apply any other filters you’d like from the Filters tab. If you only want to report on courses that learners have completed, you can select only the Completed status for Course Enrollment Status. Alternatively, I might recommend leaving all statuses checked and filtering for Completed later on in the report.
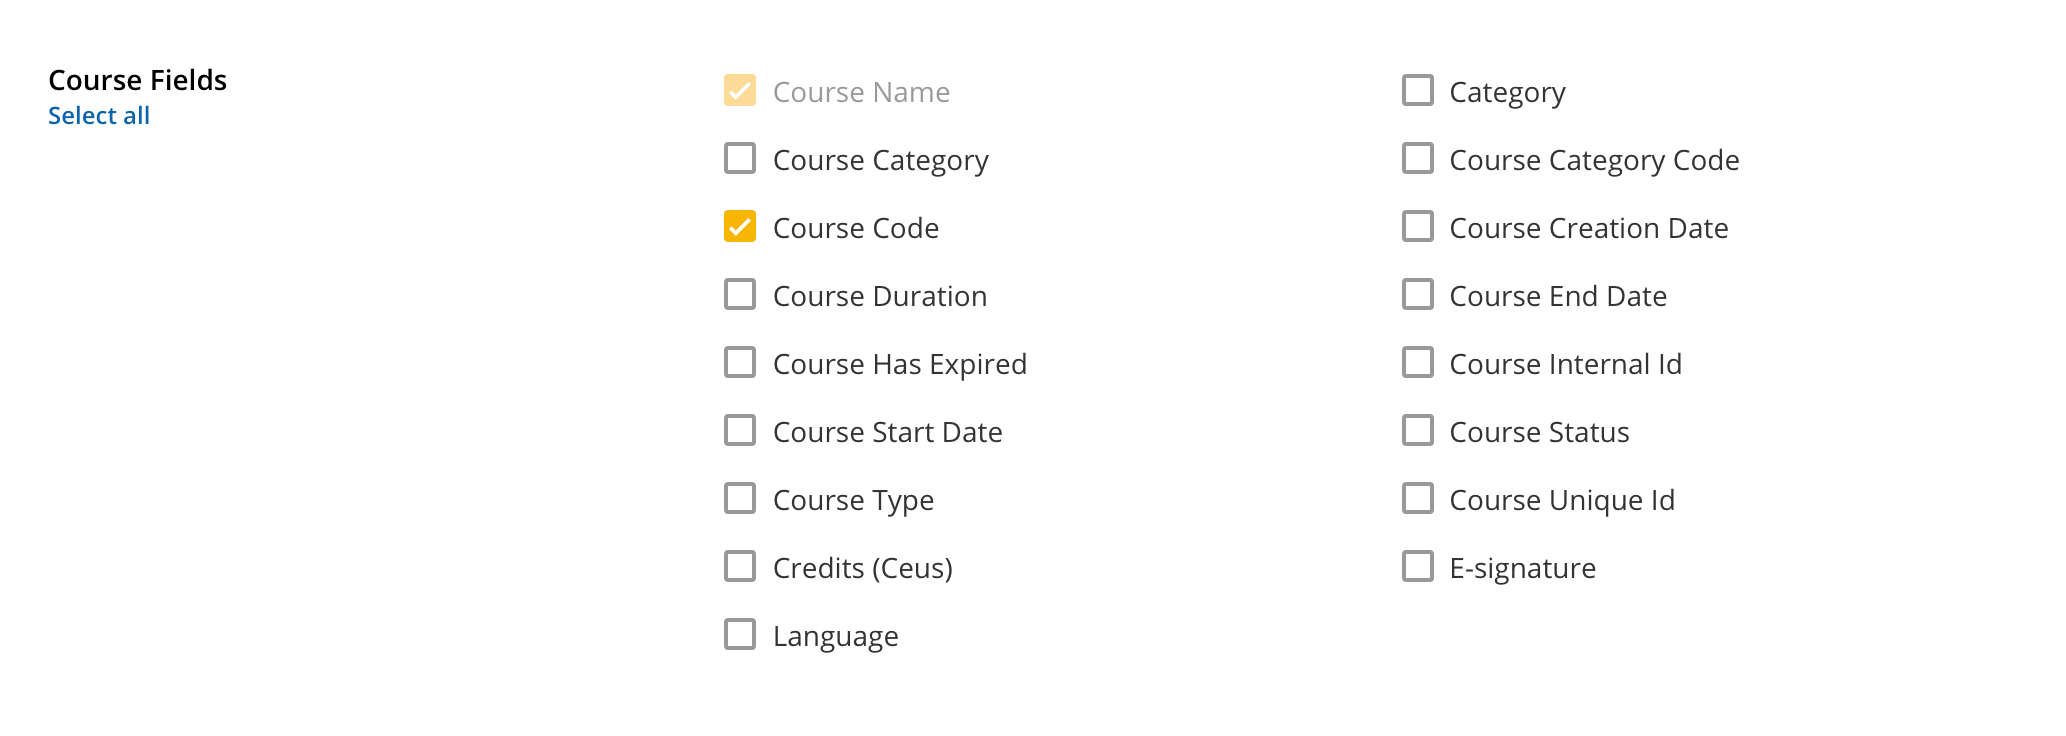
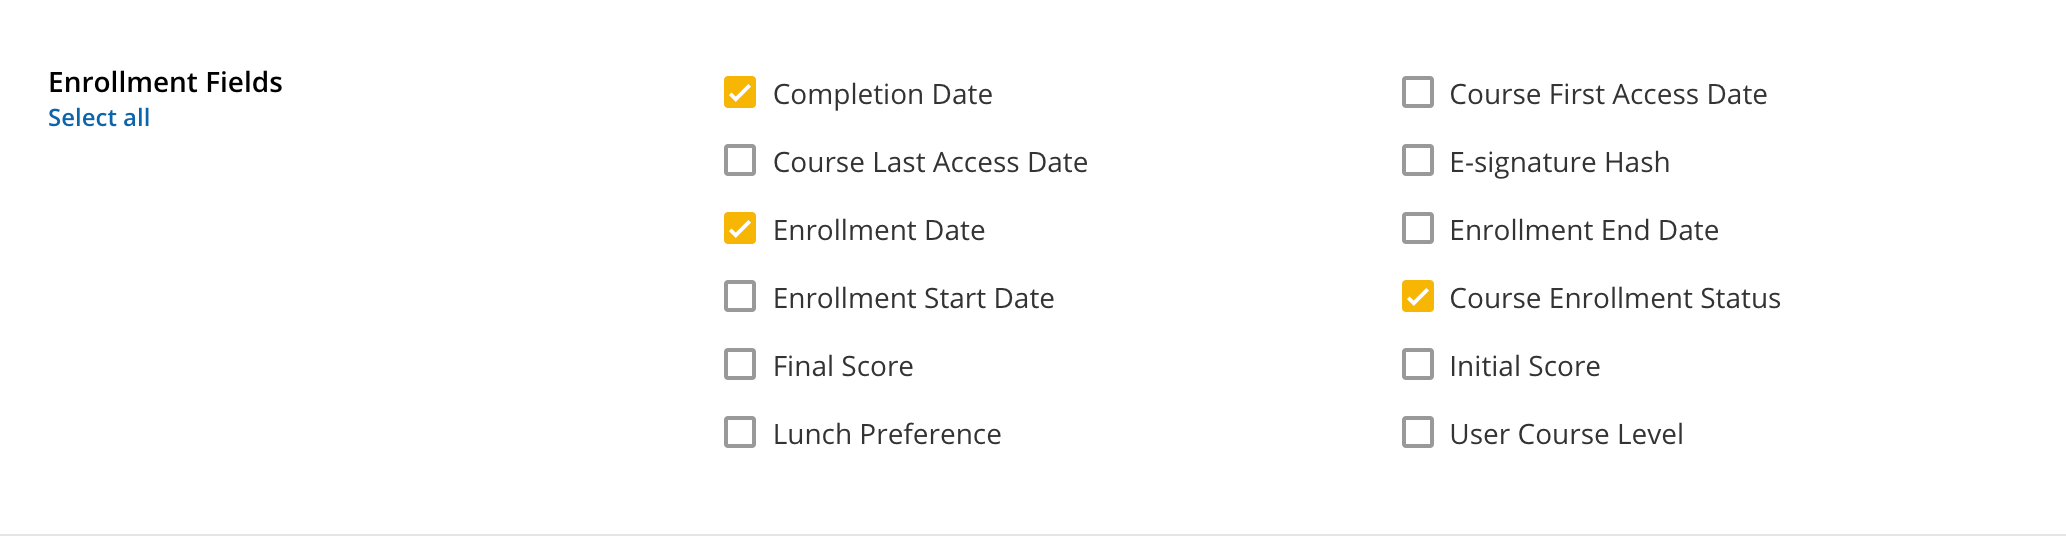
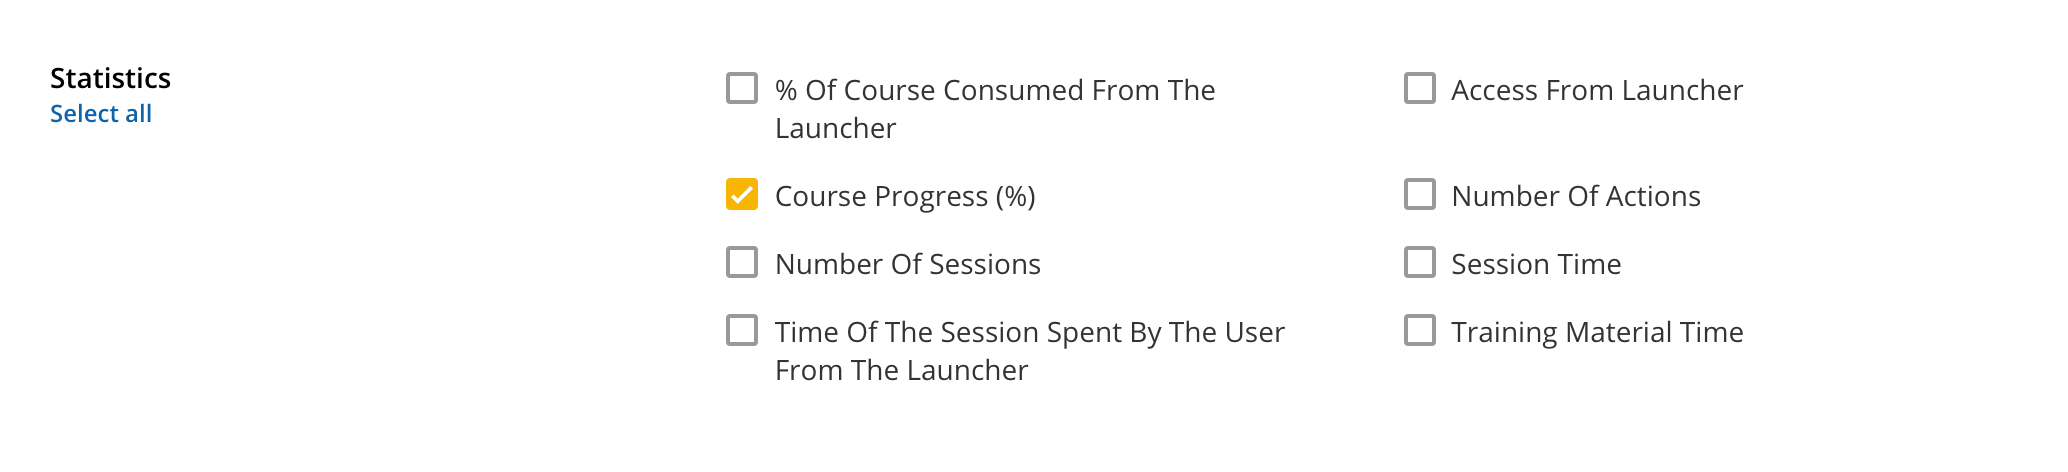
In the View Options tab, select the fields you’d like to display. Be sure to include Branches from the User Fields, and whatever Course, Enrollment, and Statistic data you’d like to include. See a screenshot below for some recommended fields to include.
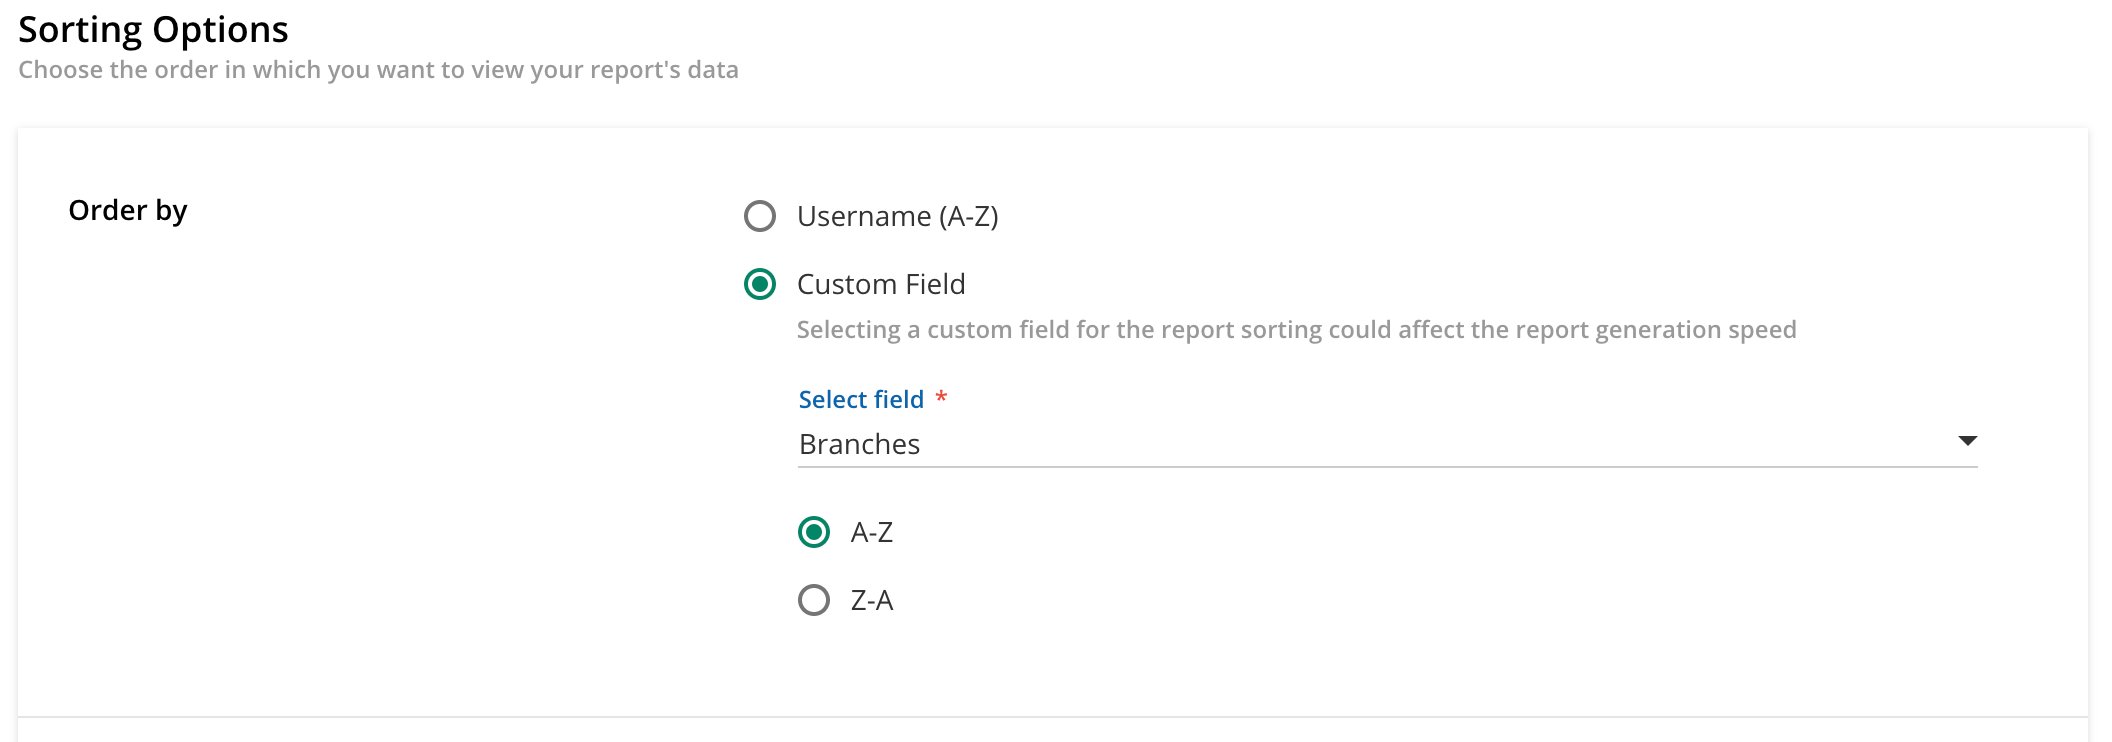
Lastly, you can use Sorting Options to sort your report by either Branches or by Course Status / Course Progress (%) and configure your custom columns sorting.
Recommended User Fields Recommended Course Fields. Depending on use case, Name + Code are often all you need. Recommended Enrollment Fields Recommended Statistics Fields Sorting Options with Branch selected as custom field for “roll-up” style report
Bonus question: Do you have a favorite custom report you’ve built?
While it’s fairly underwhelming, at the moment I’d have to say that my favorite/most used custom report is our 2021 Docebo Release Courses report. It’s a simple Courses - Users report that breaks down each of our monthly release courses by user status percentages (Completed, In Progress, Not Started) as well as our course ratings for each month’s course. It’s a great way to quickly understand how our monthly release courses are performing (shameless plug for our June 2021 Release course that is lagging in completions compared to previous months )
I know @pmo has been deep in reporting land, so he may have more to share about some of his favorite reports.
I hope this helps! This is a great topic and I would love to hear from others about some of their reporting best practices and favorite reports.


 Admin Menu > New Reports
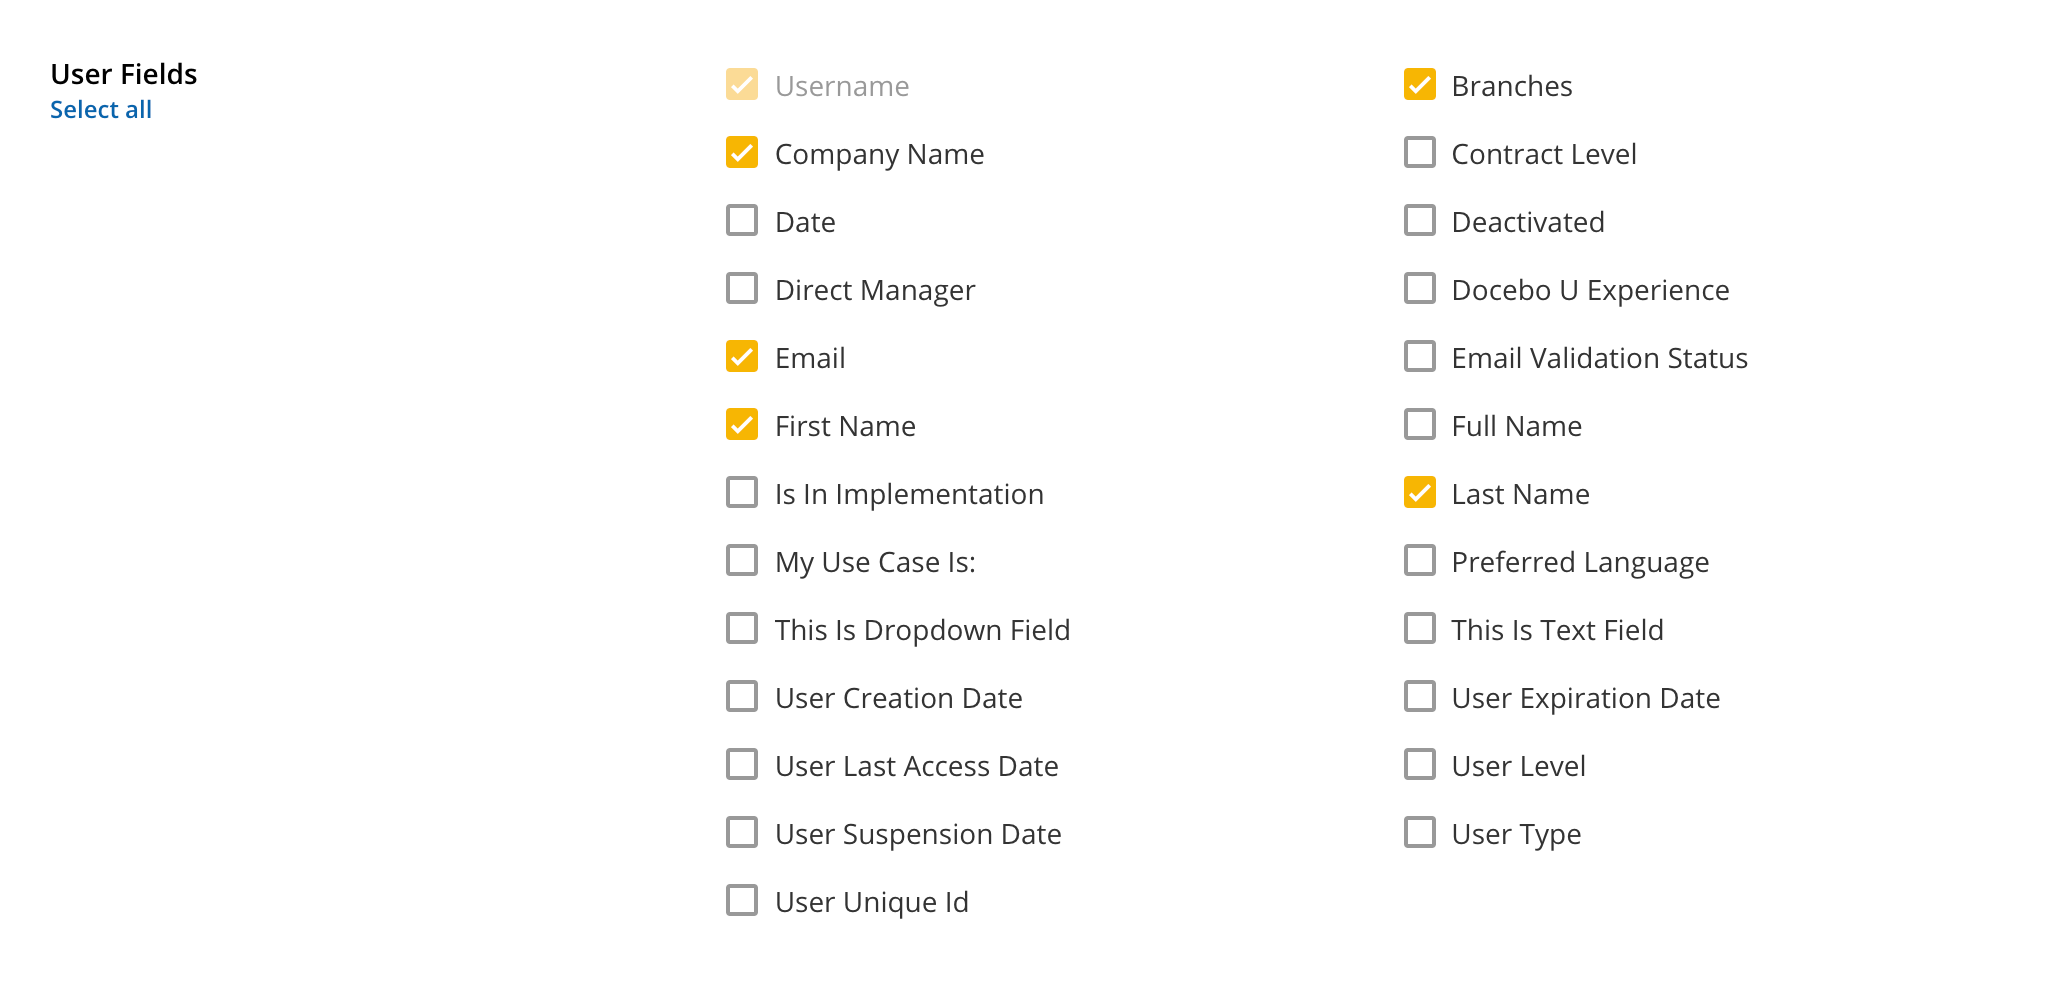
 )
)