I would like to have access to the overall activity in the platform that is not necessarily based on courses/enrollments,
How do I quickly see the number of unique logins in a period? and also include the profiles of the users logging in?
From there, can I see the actions those users took (courses enrolled in, completed, learning plans in progress and % completion?)
Some of the data is in the dashboard, but not at the higher level. We’ve just gone live, and would like to provide some initial numbers to leadership. Would it be better to use Google Analytics for this, or is this something that we could build with the Insights feature, perhaps?
Best answer by cheyenne.carpenter
Hi Belstone!
I am a Docebian that was a customer prior to joining. I remember vividly being in the same shoes you were in when we launched! I’m going to give a couple different answers to get you started, but i’m sure there are several people that can add supplemental knowledge/take you down more detailed paths.
Google Analytics: This is a great path to go down. This can give you information like how many people have accessed per day and per hour, how many are on mobile devices vs a desktop, what platform they’re running on (iOS vs Android), etc. We used data like this to provide a pulse point on how we were doing at launch, then we used it to justify making more customized pages for mobile users since we had such a high mobile use rate. Google Analytics will also give you details like age ranges of users, their interests, other sites they visit, engagement time of your site, number of page visits on each page and sort based on popularity, etc. It’s a treasure trove of information!
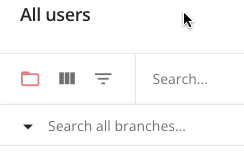
User Page: On the Users page above the branches, there are three sections (shown below).
If you go to the icon with three vertical columns, you can select which columns you want to display for your users - this is a combination of native fields from Docebo and your User Additional Fields. Last Access date is one of them! Once that is selected, you can click the header toggle the list to go in chronological or reverse chronological order - I used it to show the most recent logins just to give me some context of how many people were logging in each day! For example, I learned one branch was much more likely to have logins each day while another was more likely to have logins only on the day of the week that they had standing meetings with their direct supervisors and were reminded,
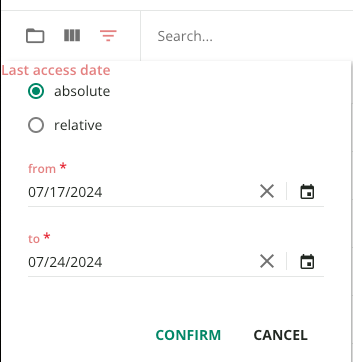
However, that tool becomes so much more valuable when you click on the inverted triangle (to the right of the three vertical columns) to add Active filters. You can add Last Access Date as a filter and use absolute (within a date range) or relative (within X number of days) filters to sort! This will apply to any view of your branches until you remove the filter.
As a result, I would go in and filter for active users only, write down how many users I had overall, then how many were in the branches for each service line I wanted to report on. Then I’d add the last access filter I wanted! Typically, I looked to find out how many users hadn’t accessed the system to get an overall number, then I’d report on how many users had accessed by service line. After I did the math, I would send out weekly updates to the tune of:
“Out of 2500 users, 80% of users have accessed at least once and 32% have accessed this week. Per service line, access numbers look like the below:
Line X: 14% have accessed, 86% never have
Line Y: 75% have accessed, 25% never have
Line Z: 92% have accessed, 8% never have.”
Summary: There are additional insights you can gain from other tools (that have become available since I was in this role ☺️) that others may be able to offer more info about, but I hope these will help in the meantime!
Feel free to ask any questions, I’m happy to clarify! Let me know if this helps!
I am a Docebian that was a customer prior to joining. I remember vividly being in the same shoes you were in when we launched! I’m going to give a couple different answers to get you started, but i’m sure there are several people that can add supplemental knowledge/take you down more detailed paths.
Google Analytics: This is a great path to go down. This can give you information like how many people have accessed per day and per hour, how many are on mobile devices vs a desktop, what platform they’re running on (iOS vs Android), etc. We used data like this to provide a pulse point on how we were doing at launch, then we used it to justify making more customized pages for mobile users since we had such a high mobile use rate. Google Analytics will also give you details like age ranges of users, their interests, other sites they visit, engagement time of your site, number of page visits on each page and sort based on popularity, etc. It’s a treasure trove of information!
User Page: On the Users page above the branches, there are three sections (shown below).
If you go to the icon with three vertical columns, you can select which columns you want to display for your users - this is a combination of native fields from Docebo and your User Additional Fields. Last Access date is one of them! Once that is selected, you can click the header toggle the list to go in chronological or reverse chronological order - I used it to show the most recent logins just to give me some context of how many people were logging in each day! For example, I learned one branch was much more likely to have logins each day while another was more likely to have logins only on the day of the week that they had standing meetings with their direct supervisors and were reminded,
However, that tool becomes so much more valuable when you click on the inverted triangle (to the right of the three vertical columns) to add Active filters. You can add Last Access Date as a filter and use absolute (within a date range) or relative (within X number of days) filters to sort! This will apply to any view of your branches until you remove the filter.
As a result, I would go in and filter for active users only, write down how many users I had overall, then how many were in the branches for each service line I wanted to report on. Then I’d add the last access filter I wanted! Typically, I looked to find out how many users hadn’t accessed the system to get an overall number, then I’d report on how many users had accessed by service line. After I did the math, I would send out weekly updates to the tune of:
“Out of 2500 users, 80% of users have accessed at least once and 32% have accessed this week. Per service line, access numbers look like the below:
Line X: 14% have accessed, 86% never have
Line Y: 75% have accessed, 25% never have
Line Z: 92% have accessed, 8% never have.”
Summary: There are additional insights you can gain from other tools (that have become available since I was in this role ☺️) that others may be able to offer more info about, but I hope these will help in the meantime!
Feel free to ask any questions, I’m happy to clarify! Let me know if this helps!
After consulting with a couple experts, it looks like Insights is not the appropriate place for this type of data; Insights is more geared for time spent on learning and tracks at the course level (rather than sign ins).
However, I did learn that your identity provider (like if you use SAML/Okta for SSO) may be able to provide some of this granular data, such as tracking sign-ins and who is accessing user-wise!
Like I mentioned, I vividly remember being in your shoes. I know my leadership was very vested in simply knowing who had seen the site and was able to access right after go-live! That being said, this is a great opportunity to set up your expectations with leadership for how you'll measure your future goals and milestones that we can track within the learning 😊