Question

How do you calculate the engagement index

  • February 27, 2025
  • 6 replies
  • 218 views

Rosalie
Guide II
Forum|alt.badge.img+1

Hello Docebo Superadmins,

Yesterday I found this interesting article from Docebo about metrics to track in the LMS.

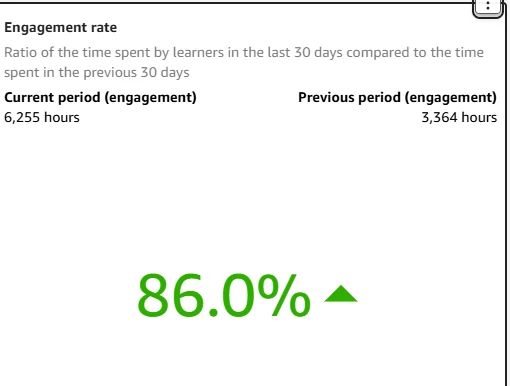
I’m wondering if you can share how do you calculate the engament index.

Thanks 

Rosalie

6 replies

smallc
Helper I
Forum|alt.badge.img+3
  • Helper I
  • February 27, 2025

Hi Rosalie,

Great question! We have 4 different course types, and configure the completion differently for the different types. Our self-paced courses mark completion by the completion of the training material. Our courses with 3-5 live events, are configured to mark completion when the learners join all the live events minus 1. For example, if a course has 5 live events, the learner must join 4 to trigger completion. We also set the navigation to sequential to help ensure that learners go through it all. I hope this is helpful!

All the best,

Cat


kmoede
Novice III
Forum|alt.badge.img+1
  • Novice III
  • February 27, 2025

@Rosalie - this is a great question. I assume you were talking about section 3- where they have the bullets about how what metrics to review. Following as I am also interested. I do believe there is a engagement rate widget in the Insights options - so this might be helpful? 


Rosalie
Guide II
Forum|alt.badge.img+1
  • Author
  • Guide II
  • February 27, 2025

Hi ​@kmoede 

Yes you’re right I was referring to the section 3. Based on that article:

Docebo calculates the engagement index based on the:

  • Number of active and enrolled learners
  • Number of times that a user accesses the platform and the number of actions they perform
  • Percentage of completed courses
  • Percentage of learners who self-enroll in courses


However, if I look at the widget you mention it says something different.


Also, I cannot find this 

Number of times that a user accesses the platform and the number of actions they perform


That’s why I was asking how the others are doing the calculation because it seems to me that is not that simple…


DanBrill
Novice II
  • Novice II
  • February 27, 2025

It looks like the Engagement Index and the Engagement Rate are two different metrics, with the latter simply looking at the % change in hours between periods.

At my company we look at the number of course completions by user as a way to measure how they get value from the system.


Rosalie
Guide II
Forum|alt.badge.img+1
  • Author
  • Guide II
  • February 28, 2025

Hey ​@DanBrill 

You’re right the engament rate is not the same nor sufficient to get the engament index. We also take into consideration completion rates and other metrics to see the engagement.

From the article written by Docebo I mentioned above that they say that we can calculate the engagement index by combining the following values that apparently we can extract from our LMS:

  • Number of active and enrolled learners
  • Number of times that a user accesses the platform and the number of actions they perform
  • Percentage of completed courses
  • Percentage of learners who self-enroll in courses

All of the above I can find the way to extract it either from the custom reports or the insights except for the “Number of times that a user accesses the platform and the number of actions they perform”. 

Also, my question is more related to, if you get all the above metrics how you combine them to get the final value of the engament rate.

Thanks,

Rosalie


DanBrill
Novice II
  • Novice II
  • February 28, 2025

the “Number of times that a user accesses the platform and the number of actions they perform”.

I’m not sure how you’d find that. It might be something that can be pulled from an API endpoint.

As for combining those into an index, I’m not sure how Docebo does it, but I do know it’s not as simple as just adding them together since those four elements have different units of measure.

So what I would do would be to standardize each measure using a Z-Score. That puts them all into the same unit of measure (standard deviations), and then I’d add those together and divide by 4.

The formula for a Z-Score is:

Z =  (X - meanX) / StdDev X

The sum of Z scores for a measure will have a mean of 0 and a std. dev. of 1.

I use these a lot when I’m creating indexes. For example, I’ve got a measure of customer health where I have 4 elements:

  • Customer Satisfaction (NPS Scores)
  • Use of our database product (database transactions per user per week)
  • Attendance at our Face to Face networking and education events over the last year
  • Use of our education program (Docebo course completions)

The big advantage (aside from being statistically valid) is that you don’t have to make some kind of judgment about which values to weight more. They are sort of “self-weighting” because items that are difficult to be different than the average get higher scores.

The downside is that some users have trouble interpreting what they mean since the unit is Standard Deviations. I just tell them that 1 is a lot and 2 is a whole lot. 3 is pretty much off the charts.


Hope that helps,

Dan