Question

Test Answer Analysis Pass/Fail Rate

  • December 3, 2025
  • 1 reply
  • 13 views

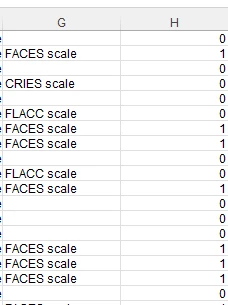
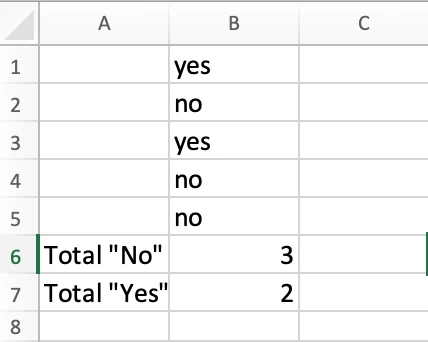
I would like some guidance on extracting/analyzing test data in a useful way. I’m having to spend a lot of time deleting cells from the report just so the data is accurate. The way the excel spreadsheet is exported it gives a Yes or No column based on how the question was answered. My understanding is that includes every question in the test and assigns a No if the test-taker didn’t answer the question (they didn’t get the question to even answer it). In the image below, I have replaced the No with a 0 and the Yes with a 1 in an effort to get an average pass/fail rate. This seems like a lot of work around. Does anyone have a better way? 


1 reply

lrnlab
Hero III
Forum|alt.badge.img+10
  • Hero III
  • December 3, 2025

I use an excel formula that counts the text. 


=COUNTIF($B$1:$B$5,"No")

=COUNTIF($B$1:$B$5,"Yes")

there is also one that will count the “blank” cells

=COUNTBLANK(B1:B11) where “B1:B11” is the range of the column where you wish to count any blank cells.


Hopefully you’ll find something useful here.


  • Author
  • Newcomer
  • December 4, 2025

Thank you for the response. I started with the COUNTIF function but quickly realized that it’s not the the answer I need. I need something to tell me the percentage of pass/fail rate. I was able to use the =AVERAGE(IF(G4:G4000<>"",H4:H4000)) formula instead. This formula ignores the blank spaces in the column with the question that is generated when the student doesn’t get that question as part of the exam but it still shows in the report.