
It’s a normal day for you, an LMS admin, until you notice something is amiss. You think, I should open a ticket with Docebo Support! Because you want this issue resolved as quickly as possible, you would like to include as much information as possible. So you read through the guide about Docebo Support Ticket Best Practices, and you find yourself asking this question: What on earth is a HAR file?
“HAR” stands for “HTTP Archive”, and it records the back and forth between your web browser and the website you’re accessing. HAR files are invaluable to support agents when they are looking into bugs and errors.
Now, before we get into the gritty details on how to generate these files, it’s important to note that HAR files alone only make up part of the picture. Because they record the results of actions you take within a web browser, it’s also important to take a screen recording while you’re generating the file. This allows support agents to compare what you do in the video with the data in the HAR file, and this acts as a guide to replicating the unexpected behavior.
We highly recommend you include BOTH a video and HAR file when you open a ticket with Docebo Support. By avoiding unnecessary back and forth, you can save yourself time and effort!
Alright, so now you understand what HAR files are and why they’re important. Let’s move onto how to generate them!
Google Chrome:
-
Open the page you need to be on to reproduce the error you’re seeing.
-
Right click on the page and choose Inspect. This will open the Developer Tools.* These MUST be opened in the tab that you are trying to record, as only actions within the same tab will be recorded.
*You can also access these by clicking on the three dot menu ![]() in the upper right corner, hovering over the More Tools category, and selecting Developer Tools.
in the upper right corner, hovering over the More Tools category, and selecting Developer Tools.
-
Select the Network tab at the top of the Developer Tools window.*

*If you don’t see the Network tab, it may be hidden. Click the >> button to reveal any hidden tabs.
-
Once selected, you should see a red circle
 in the upper left corner of the Developer Tools window. That indicates a HAR file is being recorded. Click that record button to turn it off for now. (This will make the button turn gray.)
 -
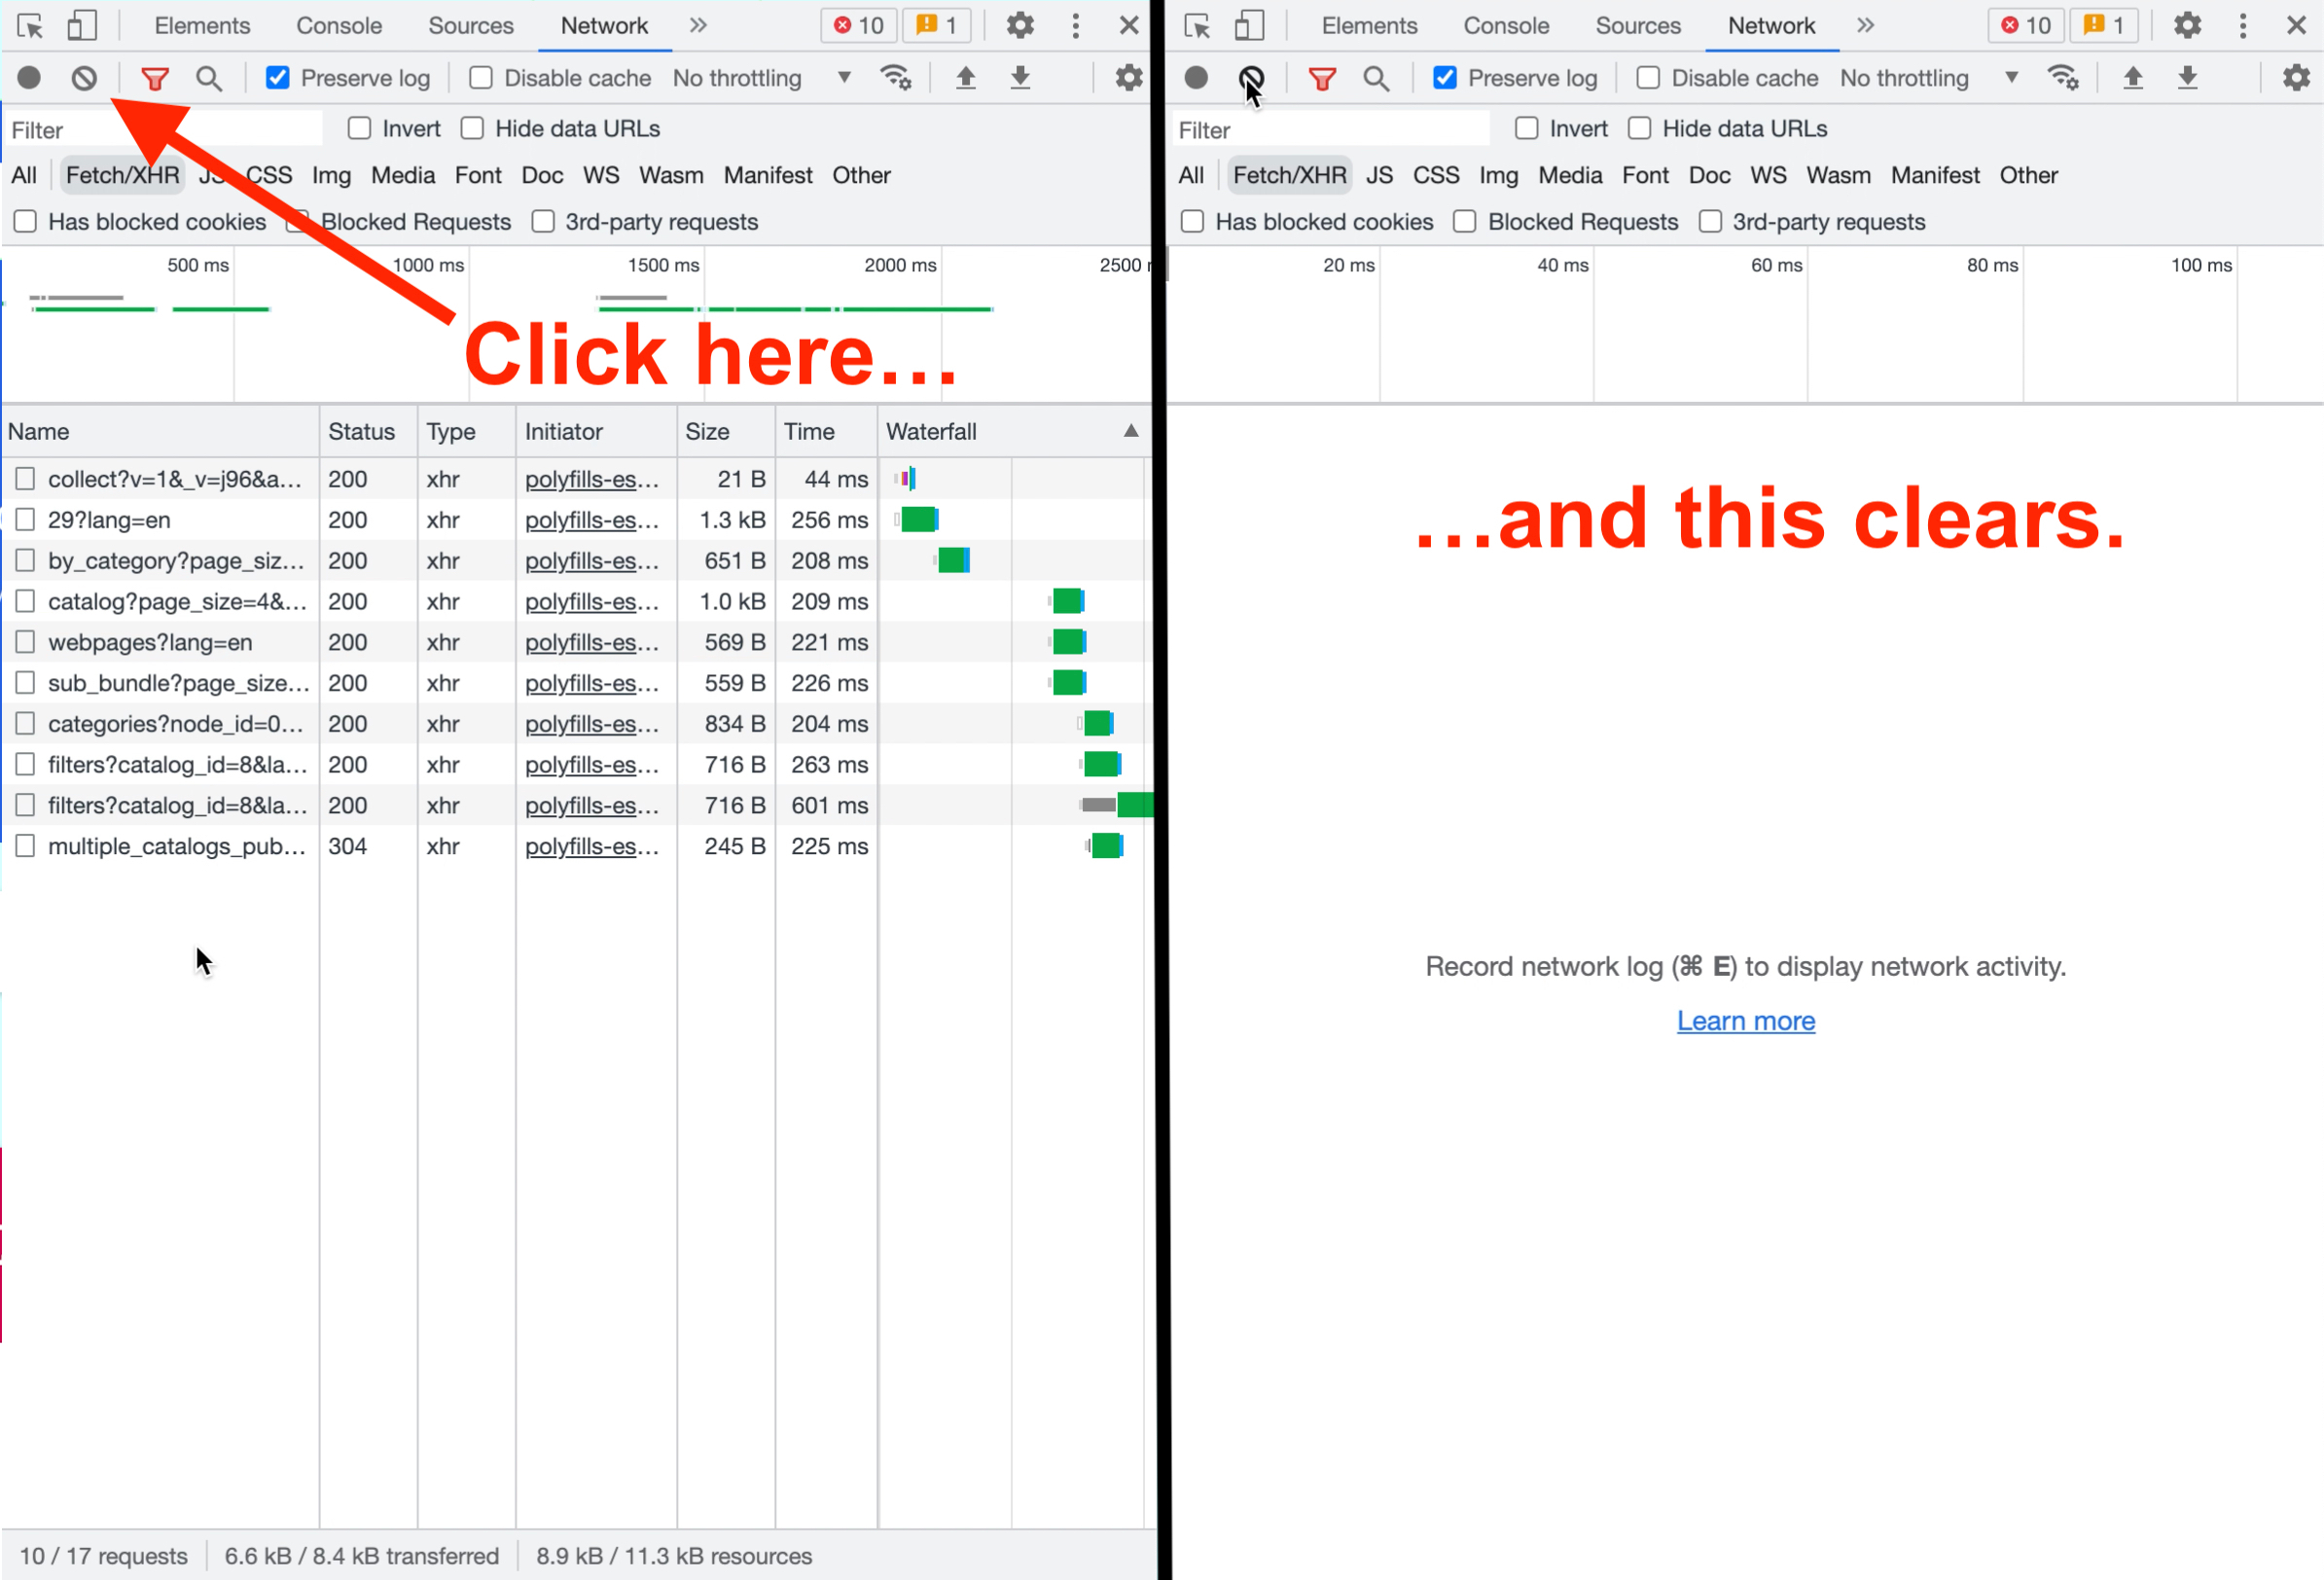
If anything appears to have been recorded already, click the “no” symbol
 next to the record button to clear it. This will ensure that you’ll start recording your HAR file from a clean slate.
- Make sure the Preserve Log toggle (in the same row as the record button) is checked.

- Now you’re all ready to record! First, start recording your screen. Make sure the entire browser window is showing in the video, including the Developer Tools window and the address bar.
- Next, press the record button
 within the Developer Tools window to begin generating the HAR file. This will once again make the button appear red.
 - Once recording, perform the actions that cause the issue to occur/appear.
- When you’re done, press the record button again to stop recording.
- Export your HAR file by clicking the downward arrow icon
 indicating a download. This icon can be found on the far left within the same row as the record button.*
*If the Developer Tools window is not wide enough, it may appear on a row below the record button.
- Save the file.
Mozilla Firefox:
-
Open the page you need to be on to reproduce the error you’re seeing.
-
Right click on the page and choose Inspect. This will open the Web Developer Tools.* This MUST be opened in the tab that you are trying to record, as only actions within the same tab will be recorded.
*You can also access this by selecting the Tools menu from the Menu Bar and finding Browser Tools. Then click Web Developer Tools.
-
Select the Network tab at the top of the Web Inspector Tools window.

- Now you’re ready to record! First, start recording your screen. Make sure the entire browser window is showing in the video, including the Web Developer Tools window and the address bar.
- All actions will be automatically recorded inside the Network tab, so you can now replicate the issue you would like to demonstrate to support.*
*If you accidentally record some unnecessary actions before you start your replication, you can click the small trash can icon ![]() in the upper left corner of the Web Developer Tools. This will clear all recorded data, so only do this if you have not yet begun testing.
in the upper left corner of the Web Developer Tools. This will clear all recorded data, so only do this if you have not yet begun testing.

-
Once you’re done, export the HAR file by clicking the cog icon
 in the upper right corner of the Web Developer Tools window and selecting Save All As HAR.
 -
Save the file.
Microsoft Edge:
-
Open the page you need to be on to reproduce the error you’re seeing.
-
Right click on the page and choose Inspect. This will open the DevTools.* These MUST be opened in the tab that you are trying to record, as only actions within the same tab will be recorded.
*You can also access DevTools by pressing F12.
-
Select the Network tab at the top of the Developer Tools window.*

*If you don’t see the Network tab, it may be hidden. Click the >> button to reveal any hidden tabs.
-
Once selected, you should see a red icon
 in the upper left corner of the Developer Tools window. That indicates a HAR file is being recorded. Click that record button to turn it off for now. (This will make the button turn black.)
 -
If anything appears to have been recorded already, click the “no” symbol
 next to the record button to clear it. This will ensure that you’ll start recording your HAR file from a clean slate.

- Make sure the Preserve Log toggle (in the same row as the record button) is checked.

- Now you’re ready to record! First, start recording your screen. Make sure the entire browser window is showing in the video, including the DevTools window and the address bar.
- Next, press the record button
 within the DevTools window. This should once again make the button appear red.
 - Once recording, perform the actions that cause the issue to occur/appear.
- When you’re done, press the record button again to stop recording.
- Export your HAR file by clicking the downward arrow icon indicating a download.
 This icon can be found on the left in the same row as the record button.*
*This button may be hidden if the DevTools window is not wide enough. If this is the case, you can expand the DevTools window to reveal the button.
- Save the file.
Safari:
-
Make sure the Develop menu is enabled for Safari. To do this, first select the Safari menu from the Menu Bar.
-
Next, select Preferences, and click the Advanced tab.
-
At the bottom of the window is a toggle to Show Develop menu in menu bar. Make sure this toggle is enabled.
Watch the video below to see how to enable the Develop menu:
- Once that’s enabled, go back into your Safari browser window and open the page you need to be on to reproduce the error you’re seeing.
- Right click on the page and choose Inspect Element. This will open the Web Inspector.* This MUST be opened in the tab that you are trying to record, as only actions within the same tab will be recorded.
*You can also access this by selecting the Develop menu from the Menu Bar and clicking Show Web Inspector.
-
Select the Network tab at the top of the Web Inspector window.

- Make sure the Preserve Log toggle in the upper right corner (next to the Import button) is checked.

- Next, click the trash can icon
 in the upper right corner to remove any previously recorded data.

- Now you’re ready to record! First, start recording your screen. Make sure the entire browser window is showing in the video, including the Web Inspector window and the address bar.
- Once recording, perform the actions that cause the issue to occur/appear.
- Export your HAR file by clicking the upward arrow icon.
 This icon can be found to the left of the Preserve Log toggle.
 - Save the file.
Congratulations! You now have the know-how to provide support with the best documentation possible so they can investigate your issue. With this, you should be able to get quicker responses and save yourself some time and energy.
Why don’t you include a video and HAR file with your next support ticket and see the difference for yourself?