
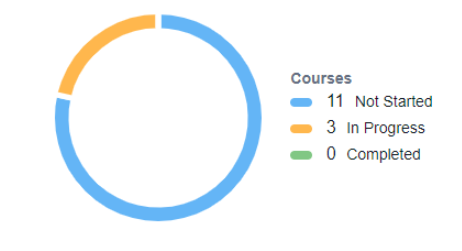
The manager wants to see all reporting user's data in a graphical view like a donut chart where it shows statistics of it.
Ex:

The manager wants to see all reporting user's data in a graphical view like a donut chart where it shows statistics of it.
Ex:
Best answer by Daniel
Hi
Is this something your manager’s would like to view on the My Team page? At the moment this is not possible, but you can vote for the ideas below to help get this and other features added in the future.
Enter your email address or username and password below to log in to Docebo Community. No account yet? Create an account
Enter your E-mail address. We'll send you an e-mail with instructions to reset your password.
