Hello!
Thank you for your message. Insights is set to get even better in the coming months.
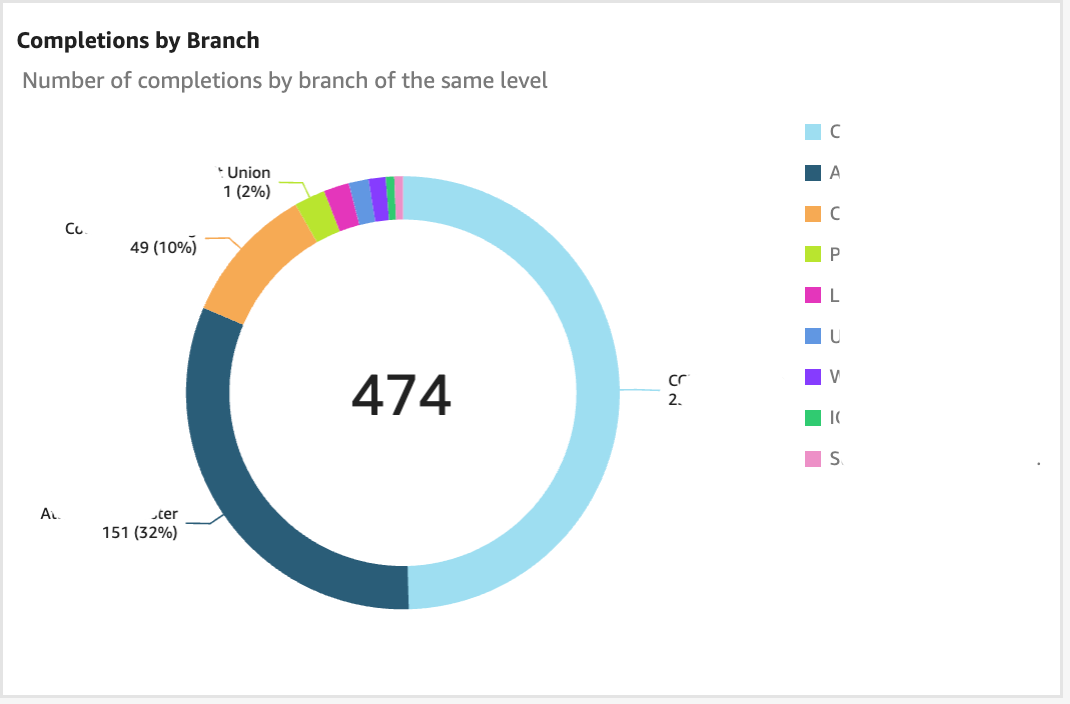
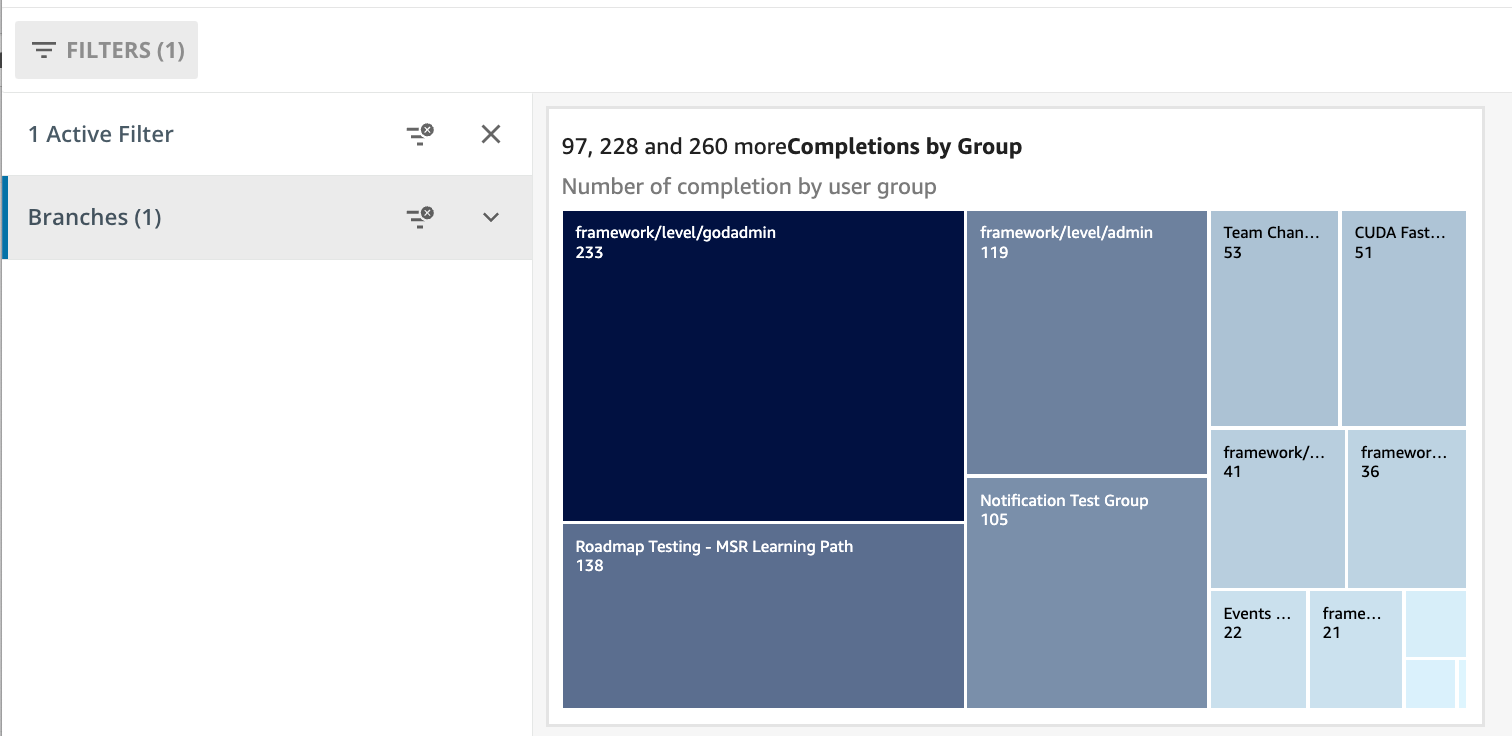
We chose to represent Groups and Branches with two different chart types (Heatmap & Donut) due to the distinct nature of these elements. Groups are all on the same level and are essentially independent of one another. In contrast, Branches have a nested structure, and by using the drill-down capabilities of a donut chart, you can easily explore all levels, up to the tenth.
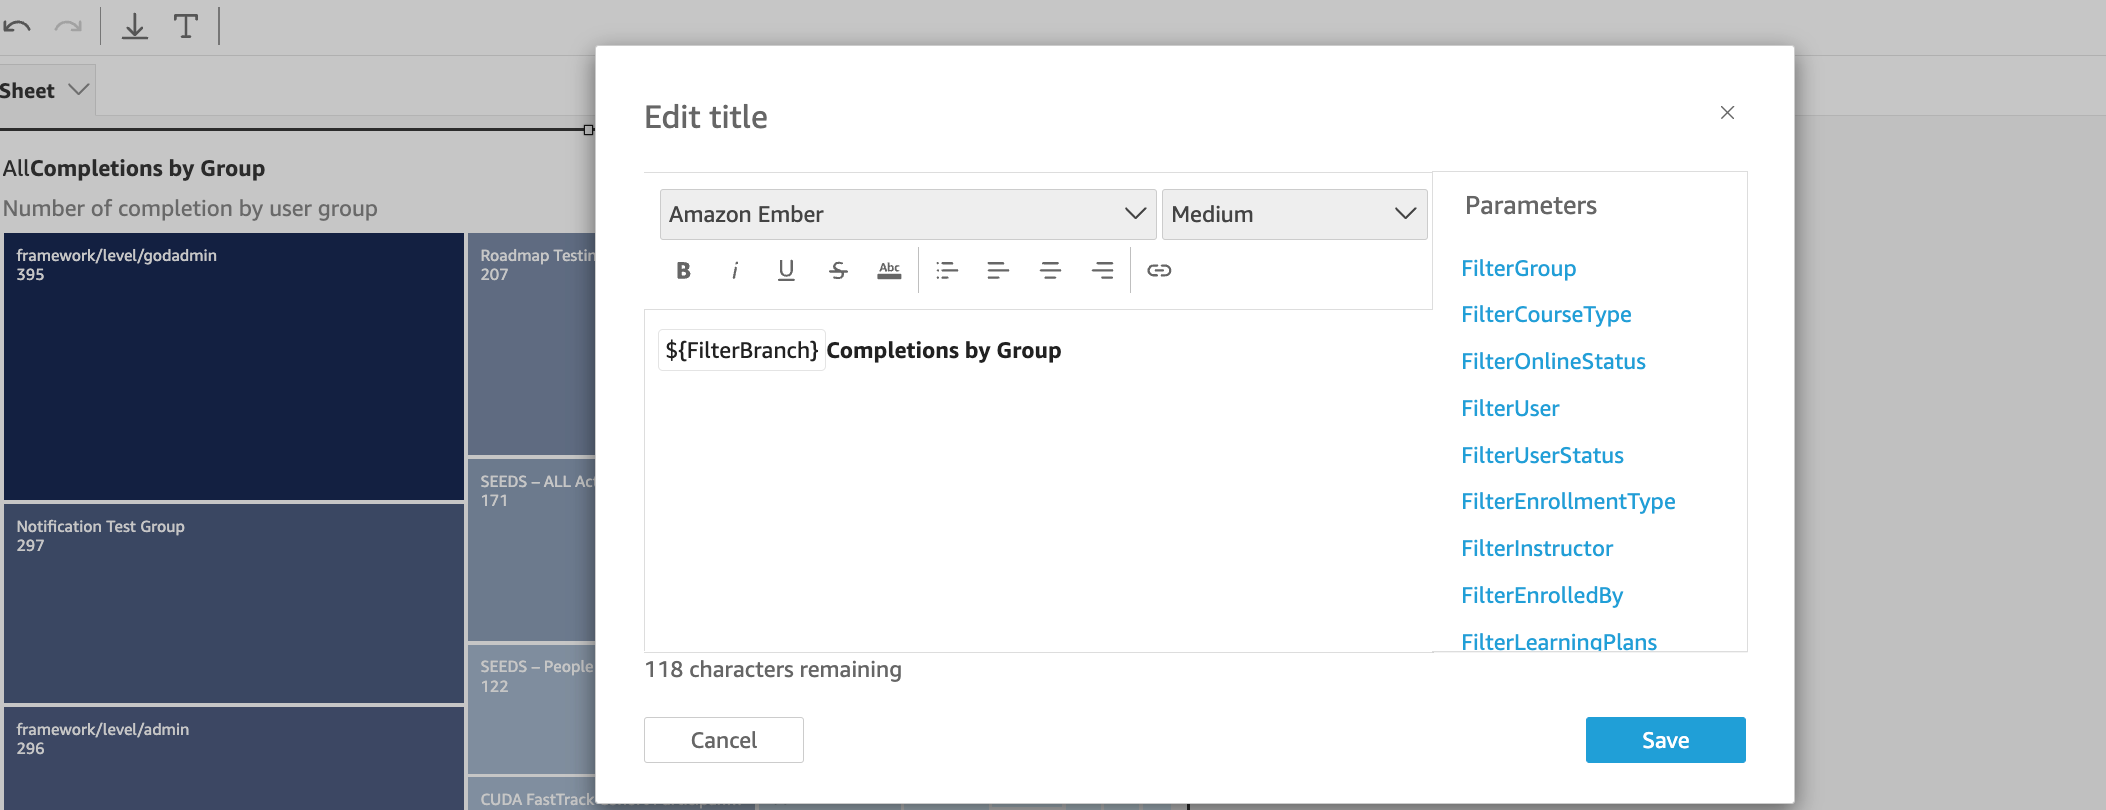
With the current version of Insights, you can create custom dashboards by combining different visuals, but modifying or customizing those visuals isn’t possible. However, we’re excited to announce the upcoming release of Advanced Insights, which will include a full-featured BI tool. This new version will allow you to create visuals from scratch and modify existing ones.
If you’re interested in this level of customization, stay tuned, Advanced Insights will be announced very soon.
Thanks!