


Hello Everyone,
I am looking for some help with improving the dashboard I am working on. I am currently facing two problems which I am unable to solve.
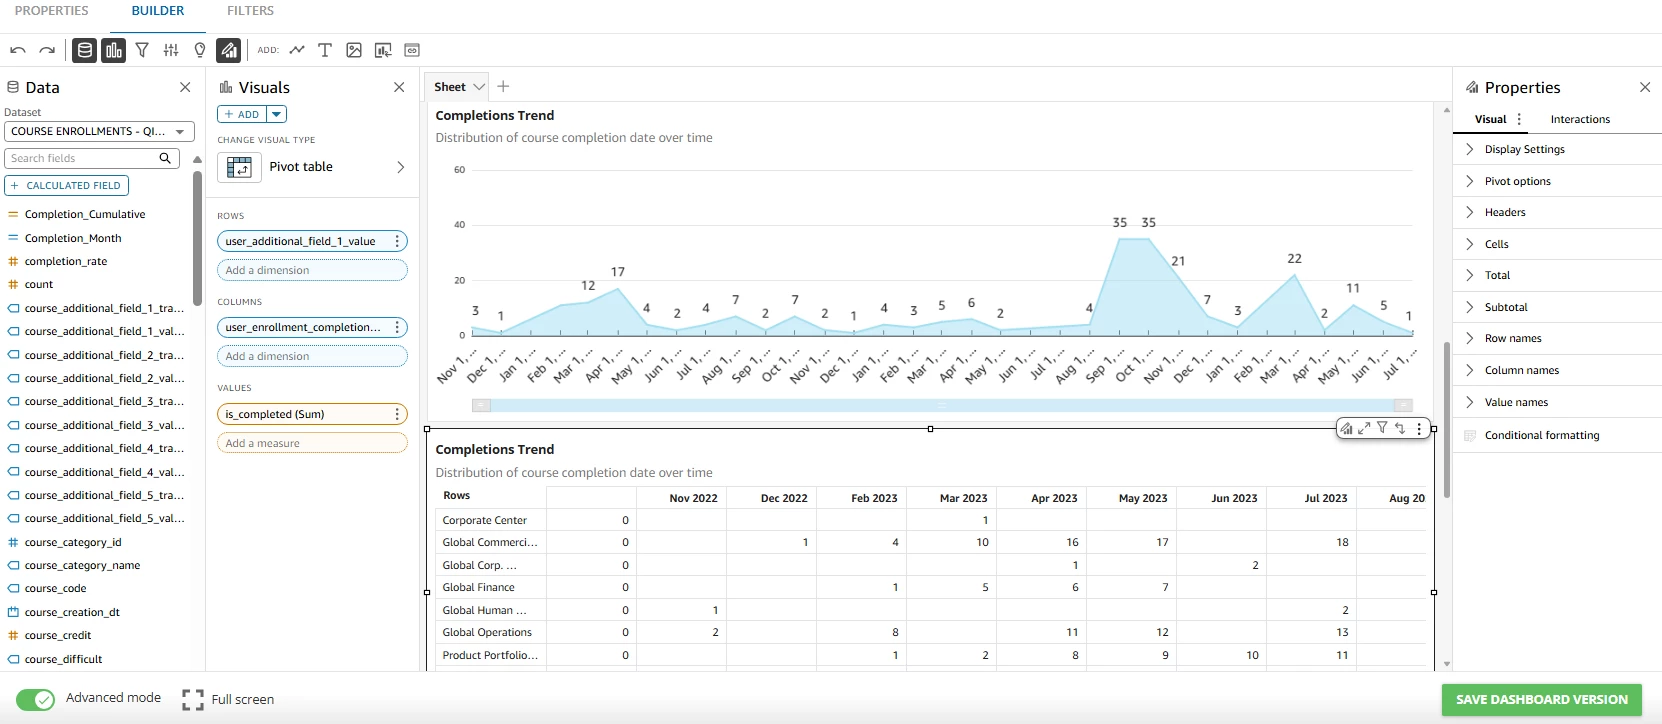
- I want completion trend graph to have accumulated data. Now it shows only completions on specific month. I want to show how it increases. Is there any possibility to achieve it? I don’t see any Running Total option here.
- In the pivot table, I have accumulated completions, but if there weren’t any completions in specific month, there is empty cell, while it should contain data from previous month. Is it possible to show it like this?
Thank you in advance for any advise.